Question
How to print graph in myQA Accept in 1:1 scale?
Answer
Step 1
Open the files to be printed. Go to File --> Print.
Step 2
As the new window with ‘Print Preview’ pops up, choose one of the template that suits your measurement type.

Step 3
After choosing the template click on Edit template button. A new window ‘Report designer' will open.
On the right side column under ‘Report Explorer’ click on the ‘Details’ and then ‘CurrentGraphControl1’.
Step 4
This will lead you to property grid as shown in pitcture.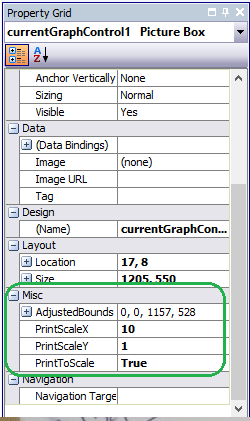
Step 5
Now udner the Misc tab as in picture the options PrintScaleX, PrintScaleY and PrintToScale are used to control Grapth printing to any scale.
- PrintScaleX as from the name is clear is used to control the scaling of X-axis.
- if the scale on X-axis is in cm then a value of 10 as shown in picture corresponds to 10 mm. This will result in 1:1 printing on X-axis.
- To make it 2:1 that is 2 cm on the graph are equal to 1 cm physically you can put the Print scaleX = 5.
Step 6
In most of the cases the Y-scale will be in percentage. So it is not possible to put a straightforward value for PrintScaleY.
It is more of a hit and trial method where one has to take some raw prints first with arbitrary values
to come to a realistic one. The best value to start with is 1.
Step 7
PrintToScale must be set to True to activate the scaling.
Step 8
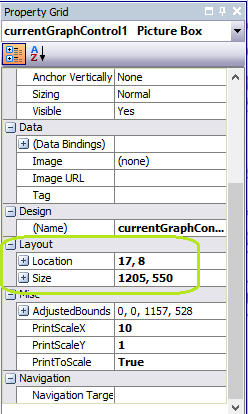
In case the graph is larger than the layout size, you can increase the display size of layout by changing the Height and Width parameters as shown below in left image.
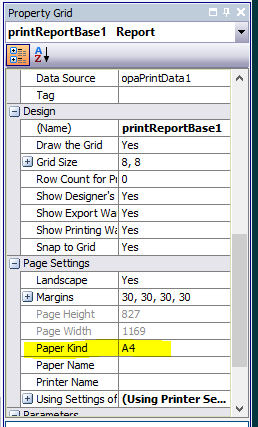
To change the paper size like A4,A5 or A3 go 2 steps back to printReportBase1 and change the Paper Kind to desired size.
Save the template and close the window.
Step 9
In the print Preview Window click on Print to get a final paper print with the attached printer.